
StockAnalysis Review 2026: Best Free Stock Research Tool?
- Free Plan: Yes
- Paid: From $79/year (Pro plan)
- Best For: Fundamental analysis, long-term investors, quick research
- Extremely fast and simple
- Clean financial data layout
- Strong free plan
- Great for quick stock checks
- Limited charting tools
- No backtesting features
- Basic alerts functionality
- Not ideal for active trading
What Is StockAnalysis.com?
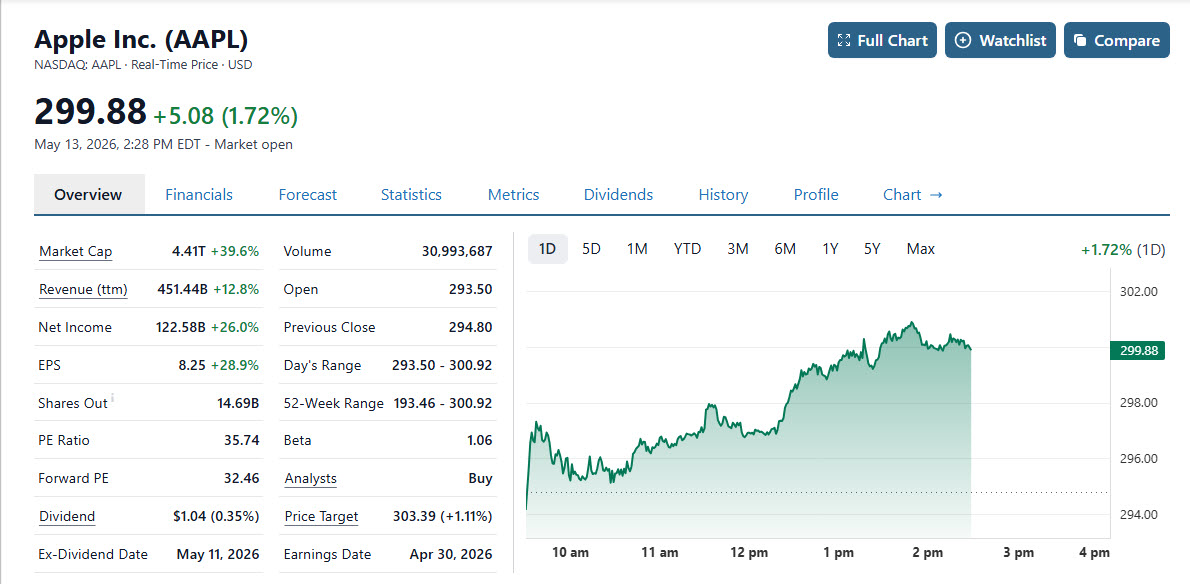
StockAnalysis.com is a lightweight stock research platform built around one core idea, giving investors fast and clear access to financial data without the clutter you see on most platforms.
Instead of overwhelming you with charts, social feeds, and endless indicators, it focuses on what actually matters for many investors, company fundamentals. You can pull up a stock and instantly see income statements, balance sheets, cash flow data, key ratios, and growth metrics, all presented in a way that is easy to scan in seconds.
What stands out when using it is how quickly you can move from searching a stock to actually understanding it. There is almost no friction compared to heavier platforms.
The platform is independently built and keeps a very lean feel. Pages load quickly, navigation is simple, and there is almost no friction between searching a stock and understanding its financial health.
The biggest difference compared to heavier tools is the experience. Where most platforms try to do everything at once, StockAnalysis strips things down to the essentials. That makes it especially useful when you want to quickly validate an idea or get a clean snapshot of a company before going deeper elsewhere.
After using it for a while, it becomes clear this is not a replacement for advanced platforms, but it is one of the fastest ways to validate an idea before going deeper.
Coverage is strongest for stocks, ETFs, IPOs, and mutual funds. Other asset classes such as options, forex, or futures are not a core focus of the platform.
If you think of tools like charting platforms or research hubs as full command centers, StockAnalysis is more like a precision tool, fast, focused, and built for clarity.
Who Is StockAnalysis Best For?
StockAnalysis is not trying to serve every type of investor, and that is exactly why it works so well for the right audience.
It is best suited for long term investors who rely on fundamentals to make decisions. If you care about revenue growth, margins, profitability, and valuation, this platform gives you what you need almost instantly. You do not need to dig through multiple tabs or build complex dashboards just to understand whether a company is improving or declining.
It is also a great fit for beginners. Many new investors get overwhelmed by platforms that throw too much information at them. Here, the structure is simple and logical, which makes it much easier to learn how to read financial data without distractions.
Another group that benefits is investors who already use more advanced tools but want a faster way to screen or double check ideas. In practice, it works very well as a first step before moving into deeper analysis elsewhere.
At the same time, it is not built for everyone. If you are a day trader who depends on intraday charts, technical indicators, or real time execution tools, this platform will feel too limited. The same applies to advanced users looking for deep analytics, custom modeling, or institutional level research.
In simple terms, it works best for investors who value speed, simplicity, and fundamentals over complexity.
The platform is also available on mobile, with apps for both iOS and Android. This makes it easy to check data and monitor stocks on the go without relying only on the desktop version.
Key Features of StockAnalysis
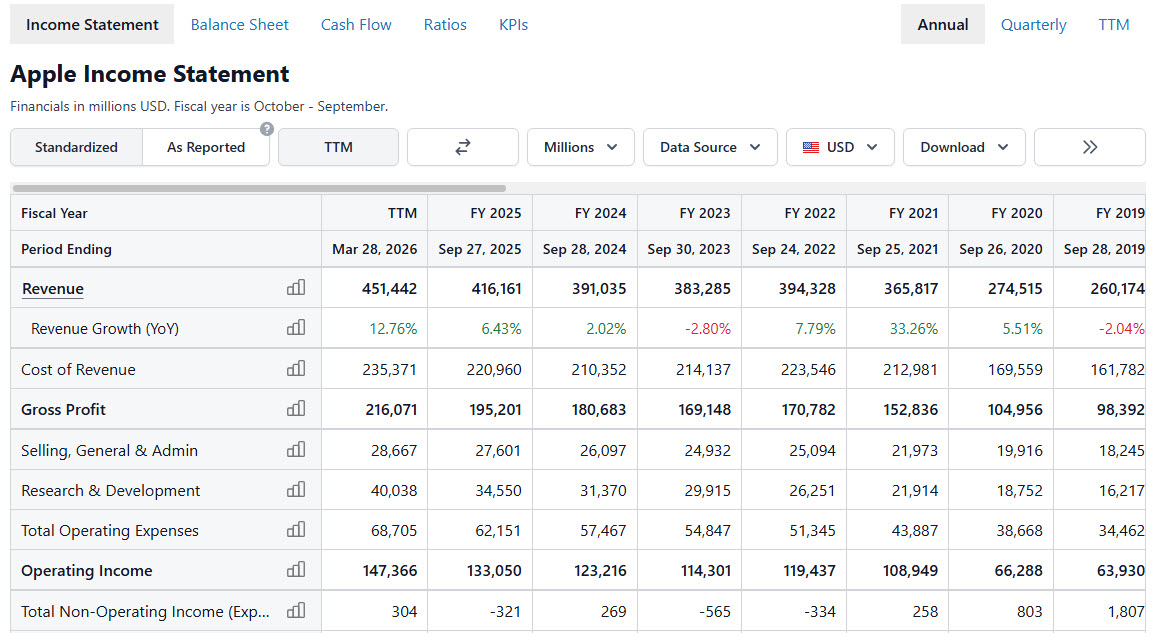
Financial Statements Made Simple
One of the strongest parts of StockAnalysis is how it presents financial statements. Income statements, balance sheets, and cash flow data are laid out in a clean and structured format that is easy to read, even if you are not deeply experienced.
You can scroll through years of historical data without friction, compare trends, and quickly spot whether a company is growing, stagnating, or declining.
In practice, this becomes one of the fastest ways to sanity check a stock. Within seconds, you can see if revenue is consistently growing, margins are improving, or if something looks off.
Another useful addition is the currency selector on financial pages. You can now convert financial statements into different currencies directly within the platform.
This is particularly helpful when analyzing international companies, as it removes the need to manually adjust figures or switch between sources.
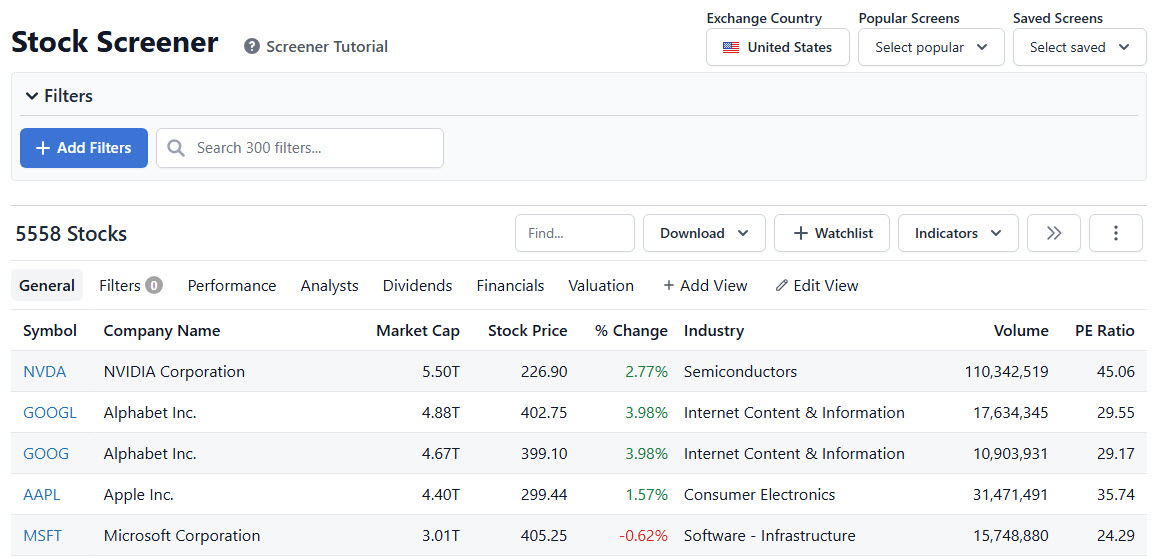
Stock and Fund Screeners
The platform includes multiple screeners, including stocks, ETFs, and a newer mutual fund screener.
The stock screener remains simple and focused on core metrics like valuation, growth, and profitability. It is not the most advanced in the market, but it is fast and effective for generating ideas.
The addition of the mutual fund screener expands the platform beyond equities. It includes filters such as asset class, risk rating, performance rating, forward P E, and portfolio concentration metrics.
This makes StockAnalysis more useful for long-term investors who want to evaluate not just companies, but also funds and diversified holdings.
The strength here is still speed. You can go from a broad idea to a filtered list quickly, without dealing with overly complex tools.
Earnings and Revenue Data
StockAnalysis makes it very easy to track how a company performs over time. You can view both annual and quarterly data, which helps you understand not just long term trends but also short term momentum.
This is especially useful around earnings season. Instead of digging through reports, you can quickly see whether a company is accelerating or slowing down.
Charting Tools
StockAnalysis also includes charting features with a range of technical indicators and drawing tools. While it is more advanced than many fundamentals-focused platforms, it is still not at the level of dedicated charting tools.
This means it works well for quick visual analysis, but traders who rely heavily on technical setups will likely need a more specialized platform.
Market Data and Ratios
The platform includes all the essential metrics you would expect, such as valuation ratios, profitability measures, and efficiency indicators.
Things like P E ratio, gross margin, operating margin, and return on equity are clearly displayed and easy to compare across time.
This allows you to quickly evaluate whether a stock is cheap or expensive relative to its performance, before deciding if it is worth deeper analysis.
Dividend Data and Yield History
StockAnalysis has expanded its dividend section by adding historical dividend yield charts for stocks and ETFs.
This allows you to see how a company’s yield has changed over time, not just the current dividend level. For income-focused investors, this adds useful context that is often missing from simpler dividend trackers.
Instead of looking at a static yield, you can evaluate whether a stock is becoming more attractive or less attractive over time based on its payout behavior.
It is a relatively simple addition, but in practice it improves how quickly you can assess dividend stability and trends.
News and Updates
StockAnalysis aggregates relevant news for each stock, giving you a quick overview of recent developments.
It does not try to turn into a social platform, which is actually an advantage. You get the information without the noise of opinions and commentary, which keeps the focus on the data.
Earnings Call Transcripts and Audio
StockAnalysis has recently added full earnings call transcripts with integrated audio playback, which is a meaningful upgrade for investors who follow companies closely.
Transcripts are available shortly after earnings calls and include an AI-generated summary at the top, making it easier to understand the key points without reading the entire call.
One particularly useful feature is the synchronized playback. As you listen to the call, the relevant sentence in the transcript is highlighted automatically, which makes it easier to follow along and revisit specific parts of the discussion.
In practice, this turns what is usually a time-consuming process into something much more accessible. Instead of switching between sources, you can read, listen, and review everything in one place.
This feature is still expanding across more stocks, but it already adds real value for investors who pay attention to management commentary and earnings tone.
Clean User Interface
The interface is one of the biggest strengths of the platform. Everything is designed to be fast, minimal, and distraction free.
Pages load quickly, data is organized logically, and you do not need to click through multiple layers to find what you are looking for.
This might sound simple, but in practice, it makes a big difference. It turns what is usually a slower research process into something much more efficient and repeatable.
Portfolio Tracking and Performance Improvements
Portfolio tracking has improved significantly, especially with the brokerage syncing feature.
You can now connect your brokerage account and automatically sync your holdings into the platform. This removes the need for manual updates and gives you a more accurate view of your portfolio.
Recent updates have also improved performance and reliability, with faster loading and fewer syncing issues compared to earlier versions.
While it is still focused on monitoring rather than execution, it is becoming a more practical tool for tracking investments in one place.
Overall platform performance has also improved. Pages load faster, portfolio data refreshes more reliably, and the experience feels more stable during regular use.
How StockAnalysis Works in Practice
StockAnalysis is built for speed, and that becomes very clear once you actually start using it.
The typical flow is simple. You search for a stock, review its key financials within seconds, and decide quickly whether it is worth deeper analysis. There is no need to open multiple tabs or build custom dashboards just to get a basic understanding.
In practice, this makes it very effective as a first step in the research process. Instead of spending time on full analysis immediately, you can filter ideas quickly and focus only on the ones that look promising.
Another useful workflow is using the screener to generate ideas, then moving into individual stock pages to validate them. This combination makes the platform efficient for both discovery and quick evaluation.
At the same time, it becomes clear that this is not a complete research environment. Once a stock passes the initial check, most investors will still move to more advanced platforms for deeper analysis, charts, or additional context.
That is really where StockAnalysis fits best, not as a full replacement, but as a fast starting point that improves overall workflow.
StockAnalysis Pricing
StockAnalysis offers one of the strongest free plans in this category, which is a big part of its appeal.
The free version includes access to financial statements, key ratios, stock screening, and most of the core functionality. For many investors, this is enough to use the platform on a regular basis without paying.
There are also two paid tiers that expand on the core experience.
The Pro plan adds deeper historical data, advanced filters, saved screeners, and removes ads. It also increases limits such as watchlist size and data access, making it more suitable for regular use.
The Unlimited plan removes most of these limits entirely, including downloads and watchlist restrictions, which is useful if you rely heavily on the platform or work with larger datasets.
Pricing is relatively affordable compared to many competitors, especially considering how much is already available for free. The platform also offers a 60-day money-back guarantee instead of a traditional free trial, which is worth noting.
In practice, the free version covers most needs, and the paid plans mainly add flexibility and depth rather than completely changing how the platform works.
StockAnalysis vs Other Platforms
StockAnalysis is often compared to platforms like TradingView, Seeking Alpha, and Finviz, but it is important to understand that it serves a different role.
Most platforms focus either on charting, deep research, or advanced screening. StockAnalysis focuses on speed and simplicity, giving you a fast way to understand a company’s fundamentals.
| Platform | Main Strength | Best For |
|---|---|---|
| StockAnalysis | Clean financial data and fast stock evaluation | Quick fundamental analysis and idea validation |
| TradingView | Advanced charting and technical tools | Technical analysis and active trading |
| Seeking Alpha | Research articles, ratings, and multiple viewpoints | Idea generation and deeper stock research |
| Finviz | Powerful stock screener and market scanning | Filtering large numbers of stocks quickly |
In practice, these platforms are often used together rather than as direct replacements.
StockAnalysis works best at the beginning of the process, helping you quickly decide which stocks deserve your attention. From there, many investors move to charting tools or research platforms for deeper analysis.
That positioning is important. StockAnalysis is not trying to replace everything. It focuses on doing one thing well, helping you move faster from idea to decision.
Strengths That Make StockAnalysis Stand Out
One of the biggest strengths of StockAnalysis is speed. Everything loads quickly, and you can move from one stock to another without any friction. This alone makes a noticeable difference when you are reviewing multiple companies in a short time.
Another key advantage is simplicity. The platform removes unnecessary layers and focuses only on what matters. Instead of building complex dashboards, you get a clean and structured view of financial data that is easy to understand.
Accessibility is also a strong point. Whether you are new to investing or already experienced, the layout makes it easy to find what you need without a learning curve.
From a practical standpoint, this combination of speed and simplicity makes it a tool that fits naturally into a daily workflow, especially when you want quick answers without overcomplicating the process.
Weaknesses You Should Know
While StockAnalysis does a lot well, it is not a complete solution for every type of investor.
One of the main limitations is the lack of advanced charting tools. If your process depends on technical analysis, indicators, or detailed price action, you will need to use another platform alongside it.
The platform is also relatively limited in customization. You cannot build highly detailed models or deeply personalize the interface the way you can with more advanced tools.
Another drawback is the absence of deep research content. Unlike platforms that provide analyst reports, opinions, or multiple viewpoints, StockAnalysis focuses mostly on raw data. For some users, that is a benefit, but others may find it lacking.
In practice, these limitations are not necessarily weaknesses if you use the platform for what it is designed to do. However, they become more noticeable if you expect it to replace more advanced tools.
There is also no built-in backtesting functionality, which limits its use for investors who rely on testing strategies or systematic approaches.
Alert functionality is also not a central feature, especially when compared to platforms that focus heavily on real-time notifications and trading signals.
Is StockAnalysis Reliable and Accurate?
StockAnalysis relies on aggregated financial data and presents it in a clear and structured format.
StockAnalysis pulls data from multiple providers, including sources like S&P Global, Fiscal.ai, Nasdaq Data Link, and others. Because of this mixed-source approach, minor discrepancies can sometimes appear between datasets or between on-page values and exported data. This is not unusual for aggregation platforms, but it is something to be aware of when working with detailed numbers.
Another important detail is that the platform has shifted part of its financial data sourcing in recent updates. For U.S. and Canadian stocks, newer providers like Fiscal.ai are often used for faster updates, while traditional sources such as S&P remain available in some cases. This helps improve update speed, but it also explains why different datasets may not always match perfectly.
It is also worth noting that downloaded data may not always match what is displayed on the platform. This happens because some data sources cannot be exported directly, so alternative providers are used for downloads.
In most cases, the data is accurate and consistent with what you would find on other financial platforms. It covers key financial statements, ratios, and historical performance, which are essential for fundamental analysis.
That said, like with any data platform, it is always a good idea to double check important information when making investment decisions. No single tool should be treated as the only source of truth.
From a practical perspective, it works well as a reliable first layer. It gives you a clear view of the numbers and helps you decide whether a stock deserves further attention.
As long as it is used as part of a broader research process, the data quality is more than sufficient for most investors.
Some documentation across the platform can lag behind recent updates, especially as new features and data sources are added. This does not affect the usability of the product, but it can create small inconsistencies in how certain features are described.
My Personal Experience Using StockAnalysis
StockAnalysis is not the type of platform you rely on for everything, but it is one that tends to stay open in your workflow once you get used to it.
What stands out over time is how often it becomes the first place you check a stock. Instead of going straight into heavier tools, it is faster to start here, get a clean view of the fundamentals, and decide whether it is worth going deeper.
This changes the way you approach research. Instead of analyzing every idea in detail, you filter quickly and spend more time only on the stronger opportunities.
Another thing that becomes clear with use is consistency. The interface does not slow you down, and the structure stays the same across all stocks, which makes the process repeatable and efficient.
At the same time, it is not a platform that replaces deeper tools. Once a stock passes the initial check, you will still need to move to charting platforms or more advanced research environments.
That balance is really where it fits best. It improves the front end of your process without trying to replace everything else.
Is StockAnalysis Worth It in 2026?
StockAnalysis is one of the most efficient tools available for quick fundamental research.
It does not try to compete with advanced platforms on depth or features. Instead, it focuses on doing one thing well, giving you fast and clear access to financial data.
For long term investors and anyone who relies on fundamentals, it offers real value, especially considering how much is available in the free version.
At the same time, it is important to understand its role. It is not a full research platform and it is not built for trading. Its value comes from improving speed and clarity at the early stage of decision making.
If your process involves reviewing multiple stocks and filtering ideas quickly, it fits very naturally. If you need deep analysis, charting, or advanced tools, it works best alongside other platforms.
In simple terms, if you want a faster and cleaner way to evaluate stocks, it is absolutely worth using.
Frequently Asked Questions
What is StockAnalysis.com used for?
StockAnalysis is used to quickly analyze stocks based on financial data such as revenue, margins, and valuation metrics. It helps investors understand a company’s fundamentals without using complex tools.
Is StockAnalysis free to use?
Yes, StockAnalysis offers a strong free plan that includes most core features. Paid plans mainly add deeper data, higher limits, and additional tools.
Is StockAnalysis worth it in 2026?
StockAnalysis is worth it for investors who want a fast and simple way to evaluate stocks. It is especially useful as a first step before deeper analysis.
How accurate is StockAnalysis data?
The data is generally accurate and sourced from multiple providers. However, minor differences can occur depending on the data source and updates.
Where does StockAnalysis get its data from?
StockAnalysis aggregates data from providers such as S&P Global, Fiscal.ai, Nasdaq Data Link, and others, depending on the dataset.
Does StockAnalysis support real-time data?
StockAnalysis provides market data and updates, but it is not focused on real-time trading or high-frequency data like dedicated trading platforms.
Can you use StockAnalysis for day trading?
It is not designed for day trading. The platform focuses on fundamentals rather than real-time charts, indicators, or execution tools.
Does StockAnalysis have charting tools?
Yes, it includes charting features with multiple indicators, but they are not as advanced as platforms like TradingView.
Does StockAnalysis have a stock screener?
Yes, it includes a built-in stock screener that allows filtering by valuation, growth, and profitability metrics.
Can you backtest strategies on StockAnalysis?
No, there is no built-in backtesting functionality, so it is not suitable for testing trading strategies.
Does StockAnalysis offer alerts?
Alert functionality is limited compared to other platforms and is not a central feature of the tool.
Can you track your portfolio on StockAnalysis?
Yes, the platform supports portfolio tracking, and paid plans allow brokerage syncing for easier monitoring.
Does StockAnalysis have a mobile app?
Yes, StockAnalysis is available on both iOS and Android, allowing users to access data and monitor stocks on mobile.
What markets does StockAnalysis cover?
It mainly covers stocks, ETFs, IPOs, and mutual funds. Other asset classes like options, forex, and futures are not a core focus.
Is StockAnalysis better than Finviz?
StockAnalysis is simpler and better for quick fundamental analysis, while Finviz offers more powerful screening and market visualization tools.
Is StockAnalysis better than Seeking Alpha?
StockAnalysis focuses on raw financial data, while Seeking Alpha provides research, opinions, and stock ratings. They serve different purposes and are often used together.


